Editing of reports
Prerequisites
- Create a report
- Access to the Settings App
Editing reports
- open the Settings app.
- click on the "Report " entry in the navigation menu.
- select the report you want to edit from the list. The following operations are now available to you:
| Operation | Description |
|---|---|
| Details | The report details can be called up and edited. |
| Archive | Reports that are no longer required can be archived. |
Report details
Click on the icon to list the report details of a report.
General information
After creating the report, you can make further settings, including name, comment, location and output format. Please note that the company cannot be changed at a later date.
| Keyword | Description | Example |
|---|---|---|
Name |
A simple text field for entering the name of the report. | Monthly_report_levels_C3 |
Comment |
A simple text field for entering a comment on the report. | Report for management |
Location |
A search field for entering the location. | Heidelberg |
Output format |
A selection option for the output format of the report. You can choose between the formats PDF, CSV and PDF/CSV. | |
Machine |
The machine to be assigned to the report. | Machine CJ102 |
Update from dashboard |
The dashboard from which the report is to be generated, filtered by Type. |
Dashboard CJ102 |
The following output formats are available for selection:
| Output format | Description |
|---|---|
| Creates a simple report as a PDF. The Grafana dashboard is written to a PDF file and any existing table panels are added to the PDF as a table. | |
| CSV | Creates a CSV file for all table panels and delivers a ZIP file. |
| PDF/CSV | Creates a ZIP file consisting of the PDF report and all CSV files. |
Configuration
This section describes the various configuration options for reports. You can define the time and time span for data collection, determine the retention period for reports and define or overwrite user-defined variables for report creation.
Time and time span
The time period of the data for the report results from the properties 'time point' and 'time span', where 'time point' represents the end of the time span from which the selected 'time span' is subtracted.
Example
An example is used to illustrate the function of the settings 'Time point' and 'Time span'.
| keyword | value | description |
|---|---|---|
Time |
00:00:00 | The start time of the report. |
Time span |
1 day | The time span that the report covers retrospectively from the start time. |
The 'Time' setting defines the start time of the report. In our example, the report starts at 00:00:00.
The 'Time period' setting determines how far back the report collects data. In this case, the report collects data for a period of one day.
Based on these settings, the report is generated on 13.01.2023 at 00:00:00 and covers the period from 12.01.2023 at 00:00:00 to 13.01.2023 at 00:00:00.
Storage
The 'Retention' setting determines how long individual reports are retained. Once the set retention period has expired, the report cannot be requested again and all download links lose their validity.
Report variables
Under the Variables tab in the configuration settings of the report, the user can define layout variables for report creation, overwrite panel-specific variables or add their own variables.
A list of the available report variables can be found here.
Creating and overwriting report variables
After selecting the "Edit" option, you can define specific report variables by clicking on "Add new variable". There are two types of variables that you can create:
| Variable type | Description |
|---|---|
| Layout variables | Variables of this type only apply to the m2v app. |
| Parameters (panel-specific variables)](../../m2v_apps/settings-app/settings_app_report.md#panelspecific-variables) | Variables of this type automatically overwrite variables of the same name in the Grafana dashboard. |
In the report settings, you can overwrite all variables defined in Grafana regardless of their type. This makes it possible, for example, to adjust the aggregation period, the aggregation function or other variables used for different purposes without having to create a new dashboard.
Please note that these overrides only apply to the creation of the respective report and have no effect on the display of the dashboard or other reports based on the dashboard.
Example
Suppose you want to change the aggregation function to average and group the data over a period of five minutes. In this case, you would need to add two new variables and select the type 'parameter' for both.
The name of the variable determines the Grafana variable to be overwritten, in this case aggrFunction and selectedInterval. The value of aggrFunction is set to mean and the value of selectedInterval is set to 5m.
Variable configuration:
| type | variable | value |
|---|---|---|
Parameters |
aggrFunction | mean |
Parameters |
selectedInterval | 5m |
After you have clicked on "Save", the new report can be generated. You can view the result here.
Prioritization of report variables
Note
For technical reasons, a new temporary dashboard must be created for an overwritten variable. This dashboard is deleted again after successful report generation.
Report variables are always prioritized as follows during report creation:
| Priority | Source | Description |
|---|---|---|
| 1 | Report settings | Variables that are defined here have the highest priority. |
| 2 | Grafana | Variables defined in Grafana have the second highest priority. |
| 3 | Default values | If no variables have been defined in the report settings or in Grafana, the default values are used. |
This means that the variables defined in the report settings have a higher priority than the variables defined in Grafana and the default values.
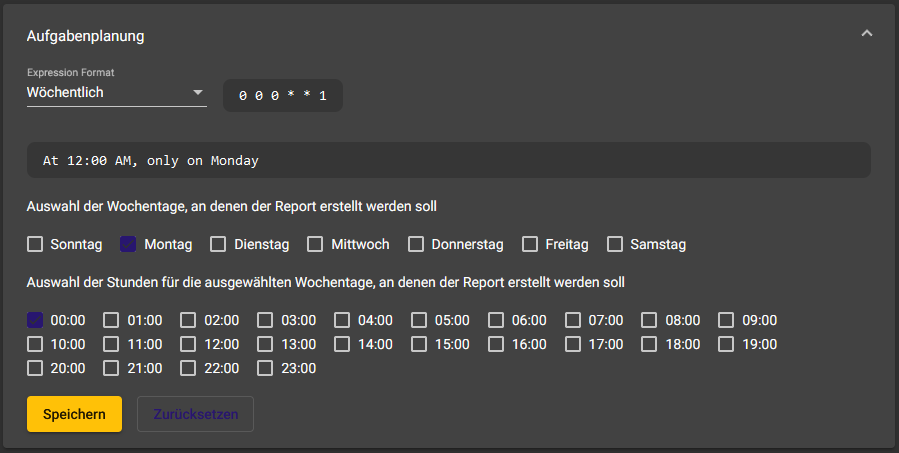
Task planning
Here the user can plan when the report should be created.
By default, reports are generated every day at 00:00 (12:00 AM). The setting Disabled in the drop-down menu deactivates the automatic generation of the report.
Example
The configuration for a report that is only generated every Monday (weekly) at 00:00 (12:00 AM) looks like this:

Cron syntax
The cron syntax is used to define schedules for the repeated creation of reports. A typical cron schedule consists of five fields separated by spaces.
| Field | Description | Possible values |
|---|---|---|
| minutes | Specifies the minute at which the command is to be executed. | 0-59 |
| Hours | Specifies the hour at which the command is to be executed. | |
| Day-of-month | Specifies the day of the month on which the command is to be executed. | |
| Month | Specifies the month in which the command is to be executed. | 1-12 or Jan, Feb, Mar, etc. |
| Day of week | Specifies the day of the week on which the command is to be executed. | 0-7 (0 and 7 stand for Sunday) or Sun, Mon, Tue, etc. |
Our implementation also uses a sixth digit at the beginning for the seconds.
The fields can be defined in different ways:
- A single number: The command is only executed at this specific time.
- Multiple numbers separated by commas: The command is executed at the specified times.
- A range of numbers separated by a hyphen: The command is executed at all times within this range.
- The asterisk (*) as a placeholder: It stands for every possible number and means that the command is executed at every minute/hour/day/month/day of the week.
Example
m2v cron syntax:
seconds minutes hours day-of-month month day-of-week
Suppose you want to create a report every day at 6 am. The cron time specification for this would be
0 0 6 * * *.
0stands for the second in which the command is to be executed (at the beginning of each minute).0stands for the minute in which the command is to be executed6stands for the hour in which the command is to be executed (6 a.m.).- The first
*stands for the day of the month and means that the command will be executed on every day of the month. - The second
*stands for the month and means that the command will be executed every month. - The third
*stands for the day of the week and means that the command is executed on every day of the week.
Overall, this cron time specification means that the command is executed every day at 6 am.
For visual support when creating cron times, you can use Crontab Guru. Please note that Crontab Guru does not support seconds.
Deployment
In this area, the user has the option of defining recipients for email notifications. During input, users who are already registered on the platform are automatically suggested and can be selected. Alternatively, the user can also enter any e-mail address.
Assignment
The assignment determines which users receive information about generated reports in the portal app.
Executions
This overview provides detailed information on past report generations, including:
- The exact time of report generation
- The success status of the report generation
- The expiration date of the report, after which the report can no longer be requested or downloaded
In addition, this overview offers the user the option of performing the following actions:
| Icon | Action |
|---|---|
| Displays details of the selected execution. In the event of an error, the error message is displayed under Result | |
| Opens the event log with all events for the selected execution | |
| Download the report again | |
| resend the notifications |
If the report has been assigned to a company, this overview is also displayed in the portal app under the corresponding company.
Archive
You can archive the selected report by clicking on . Please note that you must confirm this action beforehand.