Grafana
Grafana is an open source platform for data visualization and monitoring. It allows you to collect metrics from various data sources and present them in informative and appealing dashboards.

In our Settings app, you can create dashboards of the type "Grafana ". These dashboards can then be assigned to a specific machine to monitor and visualize specific data and metrics of that machine.
Once a dashboard has been created and assigned to a machine, it can be accessed in the portal app. There you can monitor and analyze the data (readings, messages, alarms) in real time to make informed decisions and optimize the performance of your machines.
Create Grafana dashboards
To create a new Grafana dashboard, start on the Grafana platform. Create your dashboard there and configure it according to your wishes. As soon as your dashboard is ready, navigate to the menu item "Dashboard " in the Settings app and select "Grafana" as the dashboard type when creating a new dashboard. Enter the required information and link your Grafana dashboard via a link.
-
Create Grafana dashboard
Create new Grafana dashboards and define their specific metrics and data sources.
-
Configuring the Grafana dashboard
Customize existing Grafana dashboards by changing their metrics and data sources.
In Grafana, you can select data sources, define metrics and design the layout of your dashboard. For more information and instructions on creating dashboards in Grafana, please visit the official Grafana documentation.
Linking Grafana dashboards
After the dashboard has been created in Grafana, you can link it to a dashboard in the Settings app by entering the URL of the dashboard in the corresponding field in the Create dashboard in the Settings app.
As soon as the dashboard in the Settings app is linked to the created Grafana dashboard, you can create a dashboard template. This dashboard template can then be rolled out globally to a machine template with several machines in the last step or only selectively applied to individual machines.
-
Linking a Grafana dashboard to a machine
Link created Grafana dashboards to a specific machine to monitor its data and metrics.
Grafana elements
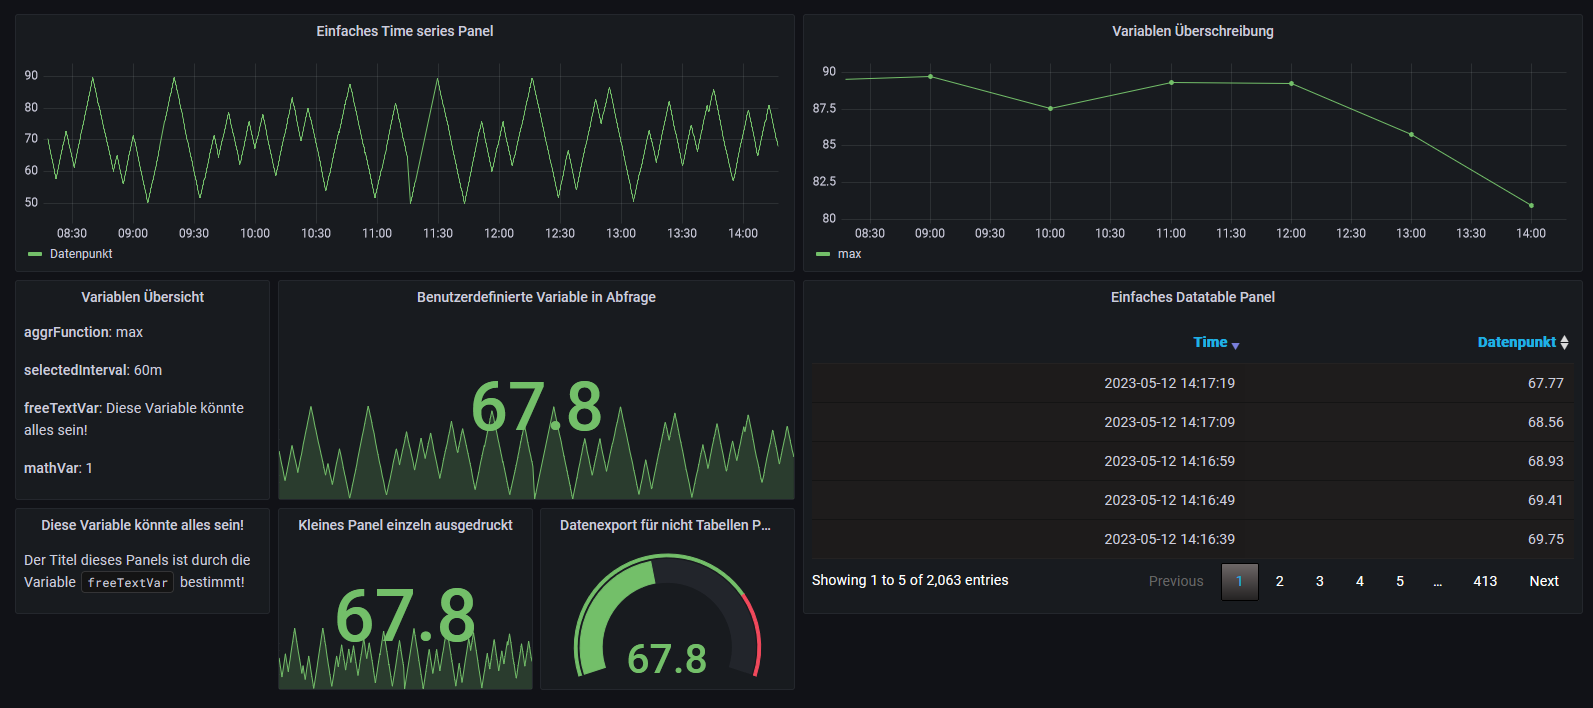
Panels
Grafana dashboards are an effective way of visualizing and analysing data. They consist of panels that can display different types of charts or tables. Each panel is connected to a data source and displays the results of a query executed on that data source.
Variables
An essential aspect of Grafana dashboards is the use of variables. Variables allow you to create dynamic dashboards that can change based on user input. For example, you can create a variable that allows users to select the time period for which data should be displayed. Variables can also be used to change certain aspects of the queries executed by the panels.